Multiple Choice
Graph shows the number of sports utility vehicles sold in the United States. represents sales in year t in thousands of vehicles. Find . 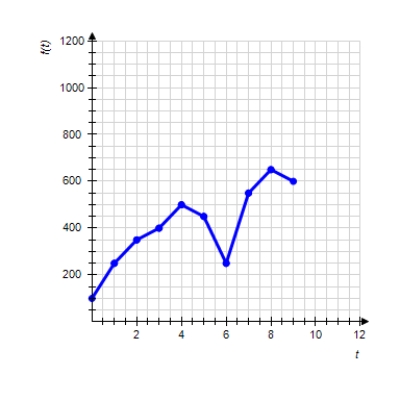
A) 400,000
B) 500,000
C) 450,000
D) 250,000
E) 600,000
Correct Answer:

Verified
Correct Answer:
Verified
Related Questions
Q18: Find the linear equation that is
Q19: Following are some approximate values of
Q20: In 2004 the Texas Bureau of
Q21: Following are forecasts of worldwide annual
Q22: Find the coefficient of correlation of
Q24: Given <span class="ql-formula" data-value="f (
Q25: Given <span class="ql-formula" data-value="f (
Q26: Estimate the slope of the line segment.<br>
Q27: Find the linear equation that is
Q28: The position of a model train,