Multiple Choice
Graph shows the number of sports utility vehicles sold in the United States. represents sales in year t in thousands of vehicles. Use the graph to estimate the largest value of for . 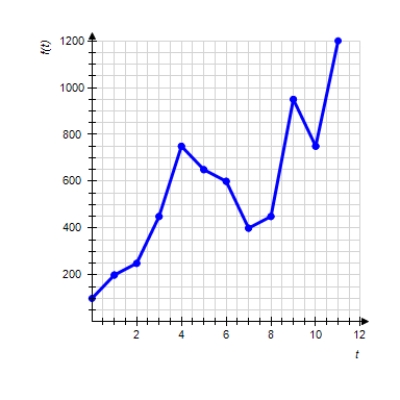
A) 950,000
B) 650,000
C) 1,200,000
D) 750,000
E) 600,000
Correct Answer:

Verified
Correct Answer:
Verified
Related Questions
Q29: Following are some approximate values of
Q30: Choose the graph of the function
Q31: The processor speed, in megahertz, of
Q32: Find the linear equation that is
Q33: Calculate the slope of the straight
Q35: Find the best-fit line associated with
Q36: Find the coefficient of correlation of
Q37: The height of the falling sheet
Q38: The chart shows second quarter total
Q39: Given <span class="ql-formula" data-value="f (