Short Answer
Graph shows the number of sports utility vehicles sold in the United States. represents sales in year t in thousands of vehicles. Use the graph to estimate the largest value of for .
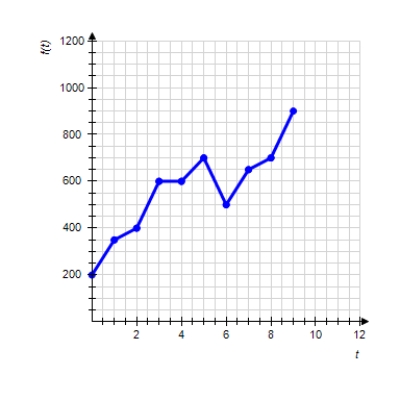
Please enter your answer as a number without the units.
Correct Answer:

Verified
Correct Answer:
Verified
Related Questions
Q140: Find the coefficient of correlation of
Q141: Based on the following table, find
Q142: Find the linear equation that is
Q143: The Oliver company plans to market a
Q144: Use technology (such as spreadsheet web
Q146: Function f is <span class="ql-formula"
Q147: Find the best-fit line associated with
Q148: Annual federal spending on Medicare increased more
Q149: Choose the graph of the function
Q150: Find the equation of the given