Short Answer
Graph shows the number of sports utility vehicles sold in the United States. represents sales in year t in thousands of vehicles. Use the graph to estimate the smallest value of for .
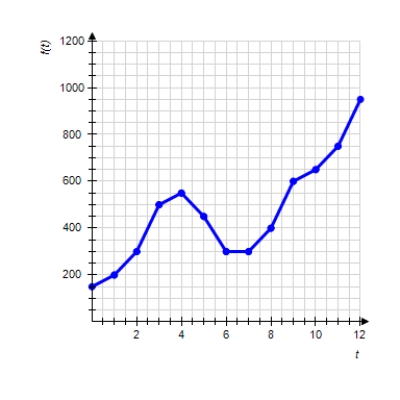
Please enter your answer as a number without the units.
Correct Answer:

Verified
Correct Answer:
Verified
Related Questions
Q149: Choose the graph of the function
Q150: Find the equation of the given
Q151: Given <span class="ql-formula" data-value="g (
Q152: a) Find correlation coefficient to the
Q153: Calculate the slope of the straight
Q154: Given <span class="ql-formula" data-value="f (
Q155: Find the best-fit line associated with
Q157: Based on the following table, find
Q158: A police car was traveling down
Q159: In 1950 the number of retirees was