Multiple Choice
The change in equilibrium shown in the accompanying figure would be explained by an) _______in the price of an input and an) _______ in the price of a_______ . 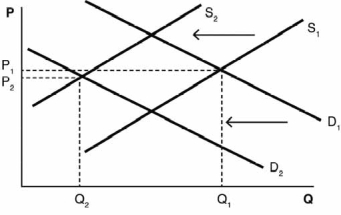
A) increase; increase; complement
B) decrease; increase; complement
C) decrease; increase; substitute
D) increase; decrease; complement
E) increase; increase; substitute
Correct Answer:

Verified
Correct Answer:
Verified
Q23: What would happen to the equilibrium price
Q62: A subsidy<br>A) is a payment made by
Q66: Without using a graph,explain the difference between
Q76: Something is an inferior good if the
Q101: Compare and contrast the differences between a
Q120: As the life expectancy in the United
Q131: A supply schedule<br>A) is a curve representing
Q133: How does the market demand reflect the
Q135: A new car is typically considered to
Q167: Firm A notices that Firm B is