Multiple Choice
Refer to the following graph to answer the following questions: 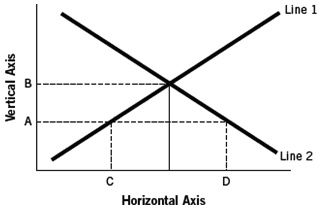
-Assuming the figure represents the market for loanable funds,and that point C represents $40 million and point D represents $70 million,then it would be true that
A) at interest rate A,the market is in equilibrium.
B) at interest rate A,there is a surplus of $30 million of loanable funds.
C) at interest rate A,there is a shortage of $30 million of loanable funds.
D) because there is a disequilibrium at interest rate A,interest rates must fall.
E) the interest rate represented by A must be greater than that represented by B.
Correct Answer:

Verified
Correct Answer:
Verified
Q27: Every _ requires a _.<br>A) savings dollar;
Q28: Lenders in the loanable funds market consist
Q29: If household wealth falls and governments run
Q30: Explain the difference in the real and
Q31: You deposit $1,000 in the bank and
Q33: The interest rate is<br>A) a cost to
Q34: If the federal government taxes the interest
Q35: If a depositor puts money in the
Q36: Every dollar borrowed<br>A) represents a dollar leaving
Q37: What is the effect of a decrease