Multiple Choice
Refer to the following graph that describes income and consumption patterns over a typical life cycle to answer the following questions: 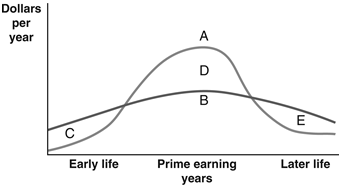
-Which part of the accompanying graph depicts dissaving?
A) curve A
B) curve B
C) region C
D) region D
E) region E
Correct Answer:

Verified
Correct Answer:
Verified
Related Questions
Q85: If time preferences increase,<br>A) the demand for
Q86: You borrow $10,000 today at a nominal
Q87: What would be an example of increased
Q88: The supply of loanable funds increases while
Q89: Why is it likely that in the
Q91: The notion of compound interest means that<br>A)
Q92: Refer to the following graph to answer
Q93: Refer to the following graph that describes
Q94: Refer to the following graph to answer
Q95: The notion of the loanable funds market