Multiple Choice
Refer to the following figure to answer the next questions.
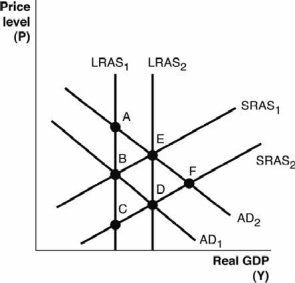
-Based on the figure, which of the following would cause the aggregate demand curve to shift from AD2 to AD1?
A) The economy has been producing more than its full-employment output level and wages and input prices begin to rise.
B) There is an increase in the price of oil.
C) There is an increase in the general price level that reduces real wealth.
D) There is a reduction in consumer confidence about future growth in the economy.
E) There is a reduction in income tax rates.
Correct Answer:

Verified
Correct Answer:
Verified
Q24: Refer to the following figure to answer
Q63: In the long run,the output of an
Q65: When an economy has a more stable
Q66: The long-run output of an economy depends
Q85: Which of the following would cause an
Q98: Adjustments in _ naturally move the economy
Q106: Starting from long-run equilibrium,draw an aggregate demand-aggregate
Q109: What happens to net export spending when
Q141: An increase in aggregate demand is beneficial
Q142: All else being equal,as the population ages