Multiple Choice
Use the following graph to answer the following questions.This graph depicts an economy where aggregate demand has decreased,with no change in either short-run aggregate supply (SRAS) or long-run aggregate supply (LRAS) .
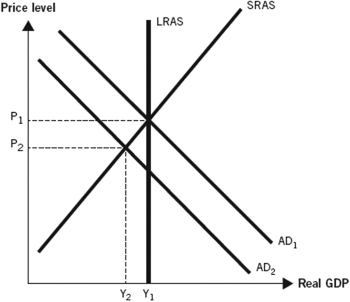
-During the Great Depression,the aggregate price level fell by 20 percent as depicted in the graph,suggesting that
A) both aggregate demand and long-run aggregate supply decreased during the Great Depression.
B) the primary cause of the Great Depression was a decrease in aggregate demand.
C) aggregate demand decreased and long-run aggregate supply increased during the Great Depression.
D) aggregate demand decreased and short-run aggregate supply increased during the Great Depression.
E) long-run aggregate supply increased,whereas short-run aggregate supply decreased during the Great Depression.
Correct Answer:

Verified
Correct Answer:
Verified
Q87: If asked about the basic functioning of
Q88: According to classical economists,changes in aggregate demand
Q89: Explain the Great Depression and the Great
Q90: When stock prices declined during the Great
Q91: Which of the following policy statements would
Q93: The Great Recession was different from other
Q94: When the government raised taxes at the
Q95: When the U.S.aggregate demand curve shifted to
Q96: Use the following graph to answer the
Q97: Use the following graph to answer the