Multiple Choice
What can be concluded from the chart below which shows inflation versus unemployment rates from 1948 to 2015) ? 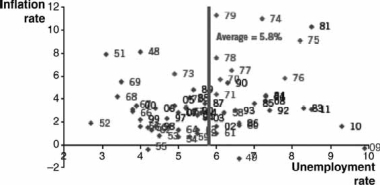
A) In the long run, the Phillips Curve is a robust model.
B) In the short run, unemployment is correlated with inflation.
C) In the long run, unemployment is correlated with inflation.
D) In the short run, unemployment is not always correlated with inflation.
E) In the long run, unemployment is not always correlated with inflation.
Correct Answer:

Verified
Correct Answer:
Verified
Q13: In the short run, expansionary monetary
Q15: From 1982 to 2008,the economy experienced only
Q20: As the prices of goods and services
Q23: Federal Reserve chairman Ben Bernanke's move toward
Q31: Explain the difference between "real" and "nominal"
Q64: What happens if aggregate demand decreases simultaneously
Q77: Contractionary monetary policy _ interest rates,causing _
Q91: The first press conference held by a
Q99: The theory behind the short-run Phillips curve
Q147: Stagflation is the<br>A) theory that people's expectations