Multiple Choice
The following table identifies the real value of exports,imports,and gross domestic product (GDP) for the U.S.economy,measured in billions of dollars for a series of years.Use the table to answer the following questions:
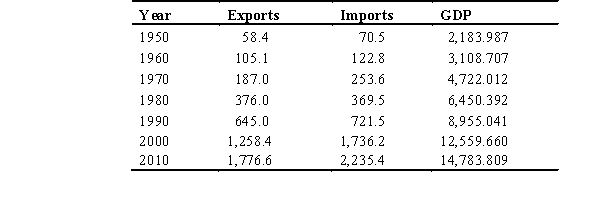
-According to the table,in the year 2000,the real value of exports as a percentage of GDP was ________ and the real value of imports as a percentage of GDP was ________.
A) 12.48; 15.45
B) 5.43; 6.12
C) 8.79; 10.68
D) 10.02; 13.82
E) 2.00; 1.30
Correct Answer:

Verified
Correct Answer:
Verified
Q83: Use the following scenario to answer the
Q84: An example of a tariff is<br>A) Japanese
Q85: Use the following scenario to answer the
Q86: The ability of one person or nation
Q87: There is a 5 percent average tax
Q89: The following table identifies the real value
Q90: Assume there is a 35 percent tariff
Q91: Esther and Ebenezer produce hamburgers and hot
Q92: The following table presents data on imports
Q93: Use the following scenario to answer the