Multiple Choice
The diagram below illustrates the international tin market. Assume that producing and consuming countries establish an international commodity agreement under which the target price of tin is $5 per pound.
Figure 7.1. Defending the Target Price in Face of Changing Demand Conditions
? 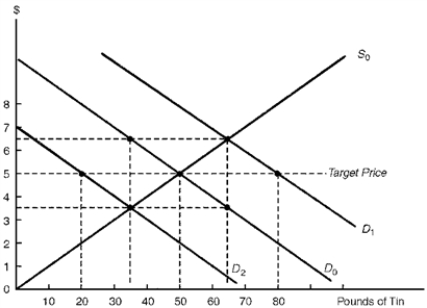
-Consider Figure 7.1.Suppose the demand for tin increases from D0 to D1.Under a buffer stock system, the buffer-stock manager could maintain the target price by
A) selling 15 pounds of tin.
B) selling 30 pounds of tin.
C) buying 15 pounds of tin.
D) buying 30 pounds of tin.
Correct Answer:

Verified
Correct Answer:
Verified
Q64: If the demand schedule for bauxite is
Q65: If the supply schedule for tin is
Q66: Developing nations overwhelmingly acknowledge that they have
Q67: Many developing countries contend that they face
Q68: A factor that discourages economic growth in
Q70: Economists note that instability of the prices
Q71: The success of buffer stocks is limited
Q72: Concerning the hypothesis that the developing countries'
Q73: Import-substitution policies are supported by the fact
Q74: To be considered a good candidate for