Multiple Choice
The diagram below illustrates the international tin market. Assume that producing and consuming countries establish an international commodity agreement under which the target price of tin is $5 per pound.
Figure 7.1. Defending the Target Price in Face of Changing Demand Conditions
? 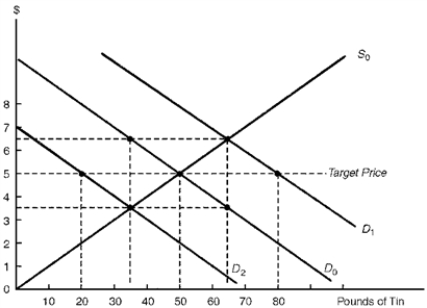
-Consider Figure 7.1.Suppose the demand for tin decreases from D0 to D2.Under a system of export quotas, the tin producers could maintain the target price by
A) increasing the quantity of tin supplied by 15 pounds.
B) increasing the quantity of tin supplied by 30 pounds.
C) decreasing the quantity of tin supplied by 15 pounds.
D) decreasing the quantity of tin supplied by 30 pounds.
Correct Answer:

Verified
Correct Answer:
Verified
Q49: Developing countries have often felt that it
Q50: Which industrialization policy used by developing countries
Q51: During periods of weak demand, OPEC has
Q52: The ability of OPEC nations to operate
Q53: In its transition toward capitalism, by the
Q55: Most developing-nation exports go to industrial nations,
Q56: Import substitution policies seek to promote industrialization
Q57: The "newly industrializing countries" of East Asia
Q58: Which method has NOT generally been used
Q59: Import substitution emphasizes decreasing reliance on international