Multiple Choice
The diagram below illustrates the international tin market. Assume that the producing and consuming countries establish an international commodity agreement under which the target price of tin is $5 per pound.
Figure 7.2. Defending the Target Price in Face of Changing Supply Conditions
? 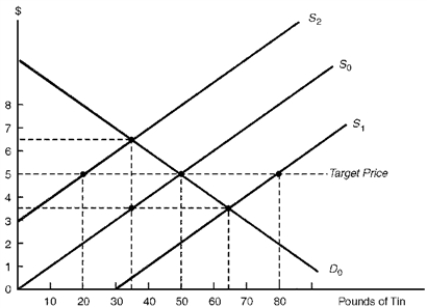
-Consider Figure 7.2.Suppose the supply of tin increases from S0 to S1.Under a buffer stock system, the buffer-stock manager could maintain the target price by
A) purchasing 15 pounds of tin.
B) purchasing 30 pounds of tin.
C) selling 15 pounds of tin.
D) selling 30 pounds of tin.
Correct Answer:

Verified
Correct Answer:
Verified
Q83: Import substitution policies make use of<br>A) tariffs
Q84: Figure 7.3. World Oil Market <img src="https://d2lvgg3v3hfg70.cloudfront.net/TB7110/.jpg"
Q85: Which trade strategy have developing countries used
Q86: Among the economic problems facing developing countries
Q87: Figure 7.3. World Oil Market <img src="https://d2lvgg3v3hfg70.cloudfront.net/TB7110/.jpg"
Q89: Stabilizing commodity prices around long-term trends tends
Q90: Recent trade patterns indicate that most of
Q91: The United Nation Conference on Trade and
Q92: A multilateral contract specifies the maximum price
Q93: Evidence shows that the largest amount of