Multiple Choice
Figure 15.1 shows the market for the Swiss franc. In the figure, the initial demand for marks and supply of marks are depicted by D0 and S0 respectively.
Figure 15.1. The Market for the Swiss Franc
? 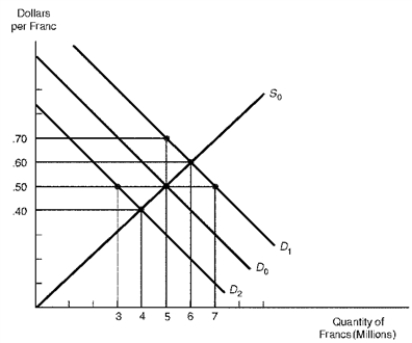
-Refer to Figure 15.1.Suppose the United States decreases investment spending in Switzerland, thus reducing the demand for francs from D0 to D2.Other things equal, under a floating exchange rate system, the new equilibrium exchange rate would be
A) $0.40 per franc.
B) $0.50 per franc.
C) $0.60 per franc.
D) $0.70 per franc.
Correct Answer:

Verified
Correct Answer:
Verified
Q88: Of the 188 members of the International
Q89: If Uganda devalues its shilling by 10
Q90: Which of the following is not a
Q91: A main purpose of exchange stabilization funds
Q92: Under the gold standard, the official exchange
Q94: When pursued over the long run, a
Q95: Other things equal, under adjustable pegged exchange
Q96: Under managed floating exchange rates, other things
Q97: The revenue that a government received by
Q98: In recent years, the United States has