Multiple Choice
Figure 13.2. The U.S. Market for Imported Toyotas
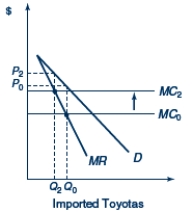
-In Figure 13.2, D represents the U.S.demand curve for Toyotas and MC0 represents the marginal cost of producing Toyotas.A shift in the marginal cost curve from MC0 to MC2 represents
A) an appreciation of the dollar relative to the yen.
B) a depreciation of the yen relative to the dollar.
C) a depreciation of the dollar relative to the yen.
D) neither an appreciation nor a depreciation of the dollar relative to the yen.
Correct Answer:

Verified
Correct Answer:
Verified
Q24: Suppose a country devalues its currency.If the
Q25: According to the absorption approach, a currency
Q26: Suppose the dollar appreciates 10 percent against
Q27: The purpose of currency revaluation is to
Q28: Which of the following is true for
Q30: According to the J-curve effect, an appreciation
Q31: The Marshall-Lerner condition asserts that if the
Q32: Assume that Brazil has a constant money
Q33: Currency devaluation is initiated by governmental policy
Q34: From 1985 to 1988 the U.S.dollar depreciated