Multiple Choice
Figure 13.2. The U.S. Market for Imported Toyotas
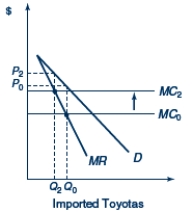
-In Figure 13.2, D represents the U.S.demand curve for Toyotas and MC0 represents the marginal cost of producing Toyotas.Assume that Toyota behaves like a monopolist in the U.S.market.A shift in the marginal cost curve from MC0 to MC2 leads to
A) a complete pass-through of the depreciation of the dollar.
B) a complete pass-through of the appreciation of the dollar.
C) a partial pass-through of the depreciation of the dollar.
D) a partial pass-through of the appreciation of the dollar.d
Correct Answer:

Verified
Correct Answer:
Verified
Q1: The shift in focus toward imperfectly competitive
Q2: Which approach predicts that if an economy
Q4: Suppose the U.S.price elasticity of demand for
Q5: An appreciation of the U.S.dollar tends to<br>A)
Q6: How do demand elasticities influence a country's
Q7: The extent to which changing currency values
Q8: When manufacturing automobiles, suppose that General Motors
Q9: Partial currency pass-through implies that if the
Q10: According to the J-curve effect, currency depreciation<br>A)
Q11: Empirical evidence regarding the effects of currency