Multiple Choice
The following figure shows the production possibilities frontier for Good A and Good B.In the figure below,point e represents: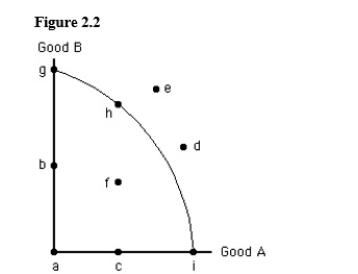
A) an attainable combination of Good A and Good B.
B) an unattainable combination of Good A and Good B.
C) the combination of Good A and Good B that the economy will produce.
D) one possible efficient combination of Good A and Good B.
E) the only unattainable combination of Good A and Good B.
Correct Answer:

Verified
Correct Answer:
Verified
Q36: Barter is<br>A)illegal in the United States<br>B)an efficient
Q48: If one person has an absolute advantage
Q49: A command economic system does not need
Q51: Bill trades a ginger snap for a
Q53: If Jeremy has an absolute advantage in
Q54: The figure below shows the production possibilities
Q55: Hans can do 4 loads of laundry
Q61: The production possibilities frontier will shift if
Q166: Points outside the production possibilities frontier represent<br>A)unemployment
Q175: It is possible for one person to