Multiple Choice
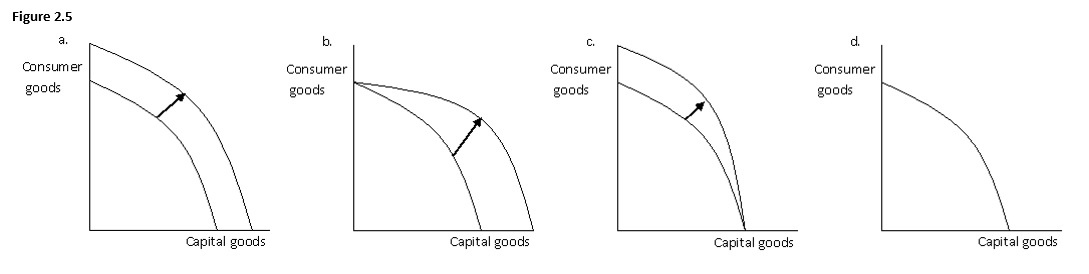
-The following figure has four graphs showing the production possibilities frontier for capital goods and consumer goods.Which of the graphs below best illustrates the impact on the production possibilities frontier of a technological improvement that will make the resources used to produce consumer goods more efficient?
A) a.
B) b.
C) c
D) d
Correct Answer:

Verified
Correct Answer:
Verified
Q22: Opportunity cost exists because<br>A)technology is fixed at
Q76: In economics,specialization means:<br>A)producing something using only one
Q77: Comparative advantage refers to:<br>A)the ability of an
Q79: <img src="https://d2lvgg3v3hfg70.cloudfront.net/TB6687/.jpg" alt=" -The figure given
Q80: A production possibilities frontier will shift inward
Q83: The law of increasing opportunity cost reflects
Q84: The opportunity cost of choosing a particular
Q93: The law of increasing opportunity cost explains
Q121: Which of the following is not a
Q153: Comparative advantage is based on opportunity costs.