Multiple Choice
Figure 4.2 shows the demand curves for a good.A shift from demand curve D to demand curve D' in the figure would be caused by a(n) :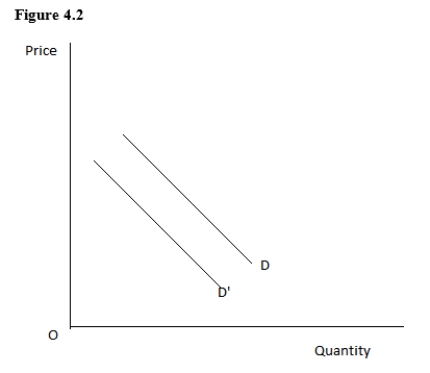
A) decrease in the price of the good under consideration.
B) significant increase in population because of immigration.
C) decrease in consumer income.
D) decrease in the number of producers of the product.
E) increase in the price of an important resource.
Correct Answer:

Verified
Correct Answer:
Verified
Q26: Which of the following is the best
Q27: Over the last few years,demand for DVDs
Q28: As shown in the figure given below,when
Q29: Suppose a market is in equilibrium.If a
Q31: The income effect of an increase in
Q32: The income effect refers to the impact
Q33: Suppose current equilibrium price of pizza is
Q34: The most important characteristic of the equilibrium
Q35: The impact of a $200 increase in
Q221: Recently it has been discovered that lobsters