Multiple Choice
The figure given below shows the supply of baby formula.Which of the following is likely to result from an increase in the price of baby formula?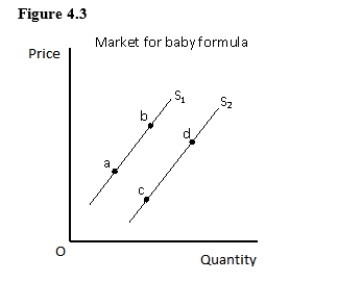
A) A movement from point a to point b on the supply curve S1
B) A leftward shift of the supply curve from S2 to S1
C) A movement from point d to point c on the supply curve S2
D) A rightward shift of the supply curve from S1 to S2
E) A movement from point b to point a on the supply curve S1
Correct Answer:

Verified
Correct Answer:
Verified
Q15: When a surplus arises in the market
Q16: Which of the following is most likely
Q17: In the figure given below,which of the
Q18: Producers supply larger quantities of any good
Q19: Two goods are considered substitutes only if
Q21: There are three consumers in the market
Q22: The equilibrium point represents the only price-quantity
Q23: In the figure given below,a price floor
Q221: Recently it has been discovered that lobsters
Q243: A price floor set below the equilibrium