Multiple Choice
The figure below shows the aggregate demand and supply curves for the U.S.The figure given below shows that between period 1 and period 2 nominal GDP changed from $40,000 to: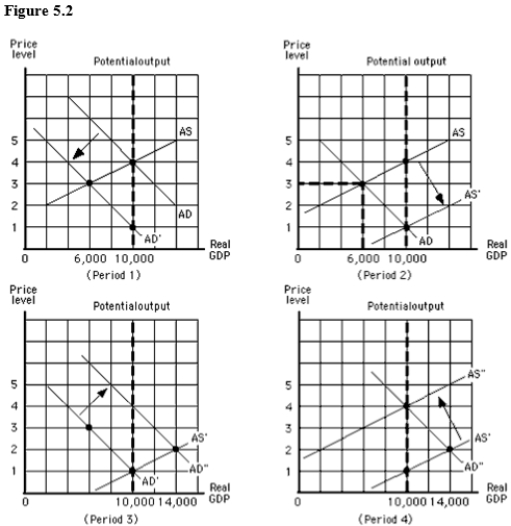
A) $18,000 and back again.
B) $18,000 and stayed there.
C) $18,000 in period 1 and to $10,000 in period 2.
D) $10,000 in period 1 and stayed there in period 2.
E) $10,000 in period 1 and to $18,000 in period 2.
Correct Answer:

Verified
Correct Answer:
Verified
Q101: Since the Great Depression,business fluctuations have become
Q102: If the government of a country owes
Q103: For a given aggregate supply curve,an increase
Q104: The aggregate supply curve represents:<br>A)the quantity of
Q105: The Employment Act of 1946:<br>A)guaranteed full employment.<br>B)allowed
Q107: From 2009 to 2013,the price level in
Q108: A federal budget deficit can simultaneously reduce
Q109: The economic policy based on the incorrect
Q110: The aggregate supply curve of an economy:<br>A)is
Q111: Which of the following was true of