Multiple Choice
The figure below shows the aggregate demand and supply curves for the U.S.In this figure,which of the following might cause a shift in the aggregate demand curve from AD to AD'?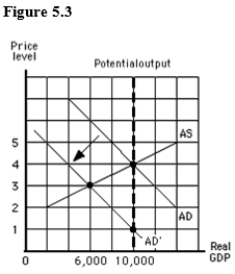
A) An increase in household wealth
B) A fall in domestic interest rates
C) An increase in government spending
D) An appreciation of the dollar relative to other currencies
E) A decrease in the nation's money supply
Correct Answer:

Verified
Correct Answer:
Verified
Q40: A fall in the price level will:<br>A)cause
Q41: Macroeconomic equilibrium is best described as a
Q42: If all firms expect greater demand for
Q43: Keynes believed that the best method for
Q44: An investment bank is a financial institution
Q46: Which of these statements best describes a
Q47: Which of the following happened during the
Q48: The aim of supply-side economics is to:<br>A)increase
Q49: Macroeconomists test their theories using controlled economy-wide
Q50: Which of these is a central argument