Multiple Choice
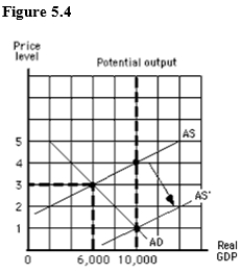
The figure below shows the aggregate demand and supply curves for the U.S.A rightward shift of the aggregate supply curve from AS to AS' would be caused by:
A) an increase in resource prices,improved technology,or an extension of patent protection.
B) a decrease in resource prices,improved technology,or an extension of patent protection.
C) a decrease in resource prices,improved technology,or a shortening of patent protection.
D) an appreciation of the dollar,higher inflation in Europe,or a decrease in resource prices.
E) a depreciation of the dollar,higher inflation in Asia,or improved technology.
Correct Answer:

Verified
Correct Answer:
Verified
Q56: The market value of all final goods
Q57: The Keynesian approach to economic policy is
Q58: _ varies along a given aggregate demand
Q59: A depression can be defined as:<br>A)a mild
Q60: The term stagflation refers to:<br>A)a simultaneous reduction
Q62: The value of a country's final goods
Q63: Stagflation is a situation with high unemployment
Q64: According to Keynes,in order to get the
Q65: An economic variable that measures something at
Q66: According to Keynes,the adoption of an expansionary