Multiple Choice
The following image shows the aggregate demand and aggregate supply curves of an economy.In the graph below,the rise in the price levels from P1 to P2 is a result of: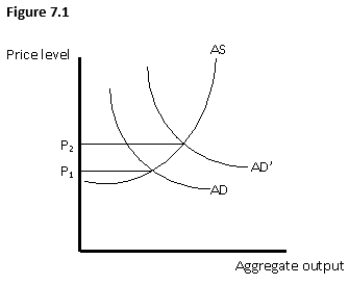
A) cost-pull inflation.
B) cost-push inflation.
C) demand-push inflation.
D) demand-pull inflation.
E) induced inflation.
Correct Answer:

Verified
Correct Answer:
Verified
Q54: Which of the following is true about
Q55: Which of the following people would be
Q56: Which of the following people would be
Q57: Ginger quits her job as personal secretary
Q58: Which type of unemployment is likely to
Q60: Which type of unemployment is most likely
Q61: The official unemployment rate disguises the extent
Q62: Which of the following is true about
Q63: If someone with a Ph.D.in philosophy finds
Q64: If the CPI is 200,then the price