Multiple Choice
The figure below shows three different per-worker production functions: PF1,PF2,and PF3.If PF1 is the initial per-worker production function for a farm,which of the following reflects an increase in the number of tractors per worker in the farm?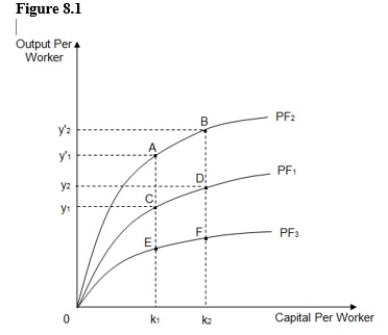
A) A movement from point D to point C
B) An upward shift from PF1 to PF2
C) A downward shift from PF1 to PF3
D) A movement from point C to point D
E) A movement from point D to point B
Correct Answer:

Verified
Correct Answer:
Verified
Q47: If per capita GDP growth exceeds labor
Q48: The production possibilities curve for capital and
Q49: Between 1982 and 2002,U.S.GDP per capita grew
Q50: Labor cost on an average accounts for
Q51: Which of the following is the prime
Q53: According to Nobel Laureate Simon Kuznets,the greatest
Q54: Over the last century,U.S.labor productivity has:<br>A)fallen.<br>B)been constant,on
Q55: If a nation moves upward along its
Q56: The share of research and development funding
Q57: Surgeons earn more than janitors because:<br>A)of the