Multiple Choice
The figure below shows the short-run aggregate supply curve of an economy.If the actual price level exceeds the expected price level,then: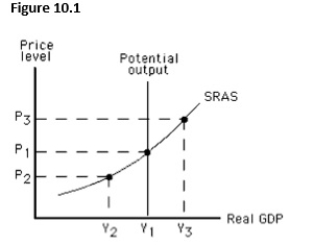
A) equilibrium output is likely to be Y2 in the short run.
B) equilibrium output is likely to be Y1 in the short run.
C) equilibrium output is likely to be Y3 in the short run.
D) potential output is greater than actual output.
E) unemployment is above the natural rate.
Correct Answer:

Verified
Correct Answer:
Verified
Q1: Which of the following is true of
Q2: In the aggregate demand-aggregate supply model,which of
Q3: The figure below shows the equilibrium in
Q4: Workers usually negotiate compensation in terms of
Q6: Which of the following is true?<br>A)The nominal
Q7: If nominal wage rates increase by 5
Q8: If the actual price level is less
Q9: The aggregate demand-aggregate supply model shows that
Q10: A nominal wage is:<br>A)always equal to the
Q11: The nominal wage represents:<br>A)the wage measured in