Multiple Choice
The figure below shows the short-run aggregate demand and supply curves of an economy.In this figure,the distance between Y1 and Y2 represents: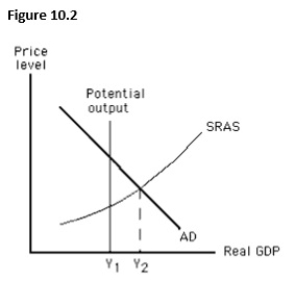
A) an expansionary gap.
B) a recessionary gap.
C) a cost-push inflation.
D) the natural rate of unemployment.
E) the full employment output.
Correct Answer:

Verified
Correct Answer:
Verified
Q42: In the long run,a decrease in aggregate
Q43: Which of the following does not influence
Q44: An adverse supply shock would shift:<br>A)only the
Q45: Suppose the real wage remains unchanged between
Q46: An economy's potential level of output can
Q48: When actual output increases the potential output,_.<br>A)more
Q49: An adverse supply shock generally decreases the
Q50: During a particular year,nominal wages increased by
Q51: When the economy is at its potential
Q52: The fact that some resource prices are