Multiple Choice
The figure below shows equilibrium in an aggregate demand-aggregate supply model.Which of the following will be true of an economy in the long run that is at point M in the short run?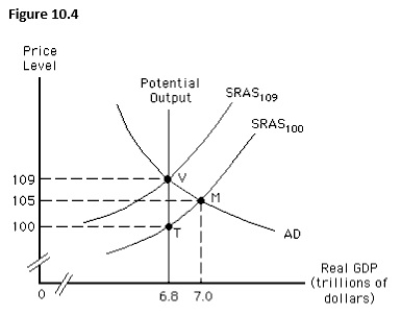
A) The actual price level will be lower than the expected price level.
B) The actual output will fall short of the potential output.
C) The short-run aggregate supply curve will remain stable at SRAS100.
D) The short-run aggregate supply curve will shift to SRAS109.
E) Real GDP will be equal to nominal GDP.
Correct Answer:

Verified
Correct Answer:
Verified
Q73: The potential output of an economy is
Q74: The amount by which actual output falls
Q75: In the long run,the price level in
Q76: The main effect of a decrease in
Q77: For the aggregate demand and aggregate
Q79: Which of the following supply shocks would
Q80: Which of the following is true if
Q81: At the potential level of output,there is
Q82: When resource prices are negotiable,the long-run aggregate
Q83: Potential output is the amount produced when:<br>A)firms'