Multiple Choice
The figure shows the determination of the equilibrium price level and real GDP in an aggregate demand-aggregate supply model.Which of the following economic changes is depicted by a movement from point e to point e'?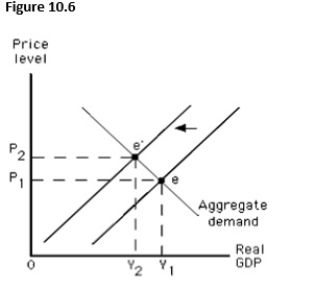
A) An increase in short-run aggregate supply
B) An increase in long-run aggregate supply
C) A decrease in short-run aggregate supply
D) A decrease in long-run aggregate supply
E) An increase in the aggregate quantity demanded
Correct Answer:

Verified
Correct Answer:
Verified
Q8: If the actual price level is less
Q9: The aggregate demand-aggregate supply model shows that
Q10: A nominal wage is:<br>A)always equal to the
Q11: The nominal wage represents:<br>A)the wage measured in
Q12: Potential output depends on all of the
Q14: The short run is a period of
Q15: Which of the following explains the shape
Q16: Which of the following is true when
Q17: The figure below shows equilibrium in an
Q18: The potential output of an economy is:<br>A)the