Multiple Choice
The figure given below depicts long run equilibrium in an aggregate demand-aggregate supply model.The change in real GDP in this figure from Y1 to Y2 could have been caused by: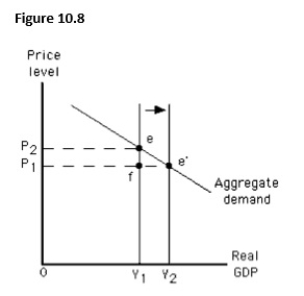
A) a government policy aimed at increasing demand.
B) a change in weather conditions that led to worldwide crop failures.
C) an attempt by key resource producers to monopolize supply.
D) an increase in taxation or a decrease in government spending.
E) an increase in labor productivity.
Correct Answer:

Verified
Correct Answer:
Verified
Q55: Stagflation is defined as:<br>A)decreased output accompanied by
Q56: The figure below shows short-run equilibrium in
Q57: If the price level increases by 5
Q58: Which of the following is most likely
Q59: Which of the following if true would
Q61: The figure below shows equilibrium in an
Q62: Which of these does not hold true
Q63: The short-run equilibrium output in the economy
Q64: Which of the following changes best represents
Q65: In 2009,actual output in the U.S.was 4.7