Multiple Choice
The figure given below shows equilibrium in a money market.If S is the supply curve,the equilibrium interest rate and quantity of money will be: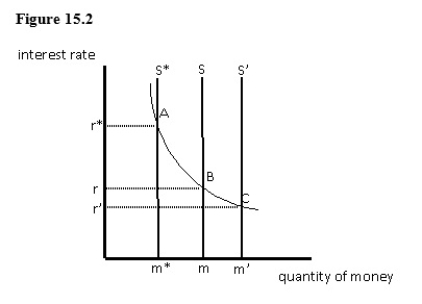
A) r and m,respectively.
B) r* and m*,respectively.
C) r' and m',respectively.
D) r and m',respectively.
E) r' and m*,respectively.
Correct Answer:

Verified
Correct Answer:
Verified
Q42: Which of the following changes will cause
Q43: The equilibrium interest rate in a money
Q44: Since the Federal Reserve was established in
Q45: According to the equation of exchange,if the
Q46: When calculating how much changes in the
Q48: When the Fed adopts an expansionary monetary
Q49: Which of the following identities describe the
Q50: If the short-run aggregate supply curve is
Q51: Which of the following changes is most
Q52: The Fed uses the federal funds rate