Multiple Choice
The figure given below shows short run and long run equilibrium in an aggregate demand-aggregate supply model.The economy shown in this figure is: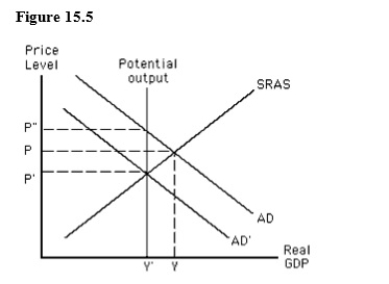
A) in a long-run equilibrium at the price level P and income level Y.
B) in a short-run equilibrium at the price level P and income level Y.
C) experiencing a contractionary gap at price level P and income level Y.
D) experiencing an expansionary gap at price level P" and income level Y'.
E) in a short-run equilibrium at the price level P' and income level Y.
Correct Answer:

Verified
Correct Answer:
Verified
Q1: The higher the interest rate,the greater the
Q3: The velocity of money is defined as:<br>A)the
Q4: If the Fed increases the money supply,then:<br>A)the
Q5: In an economy in which velocity is
Q6: According to the equation of exchange,if real
Q7: An increase in aggregate demand will have
Q8: In the short run,a decrease in the
Q9: Planned investment expenditures will eventually decrease after:<br>A)the
Q10: The figure given below shows the interest
Q11: If the Fed sells U.S.government securities in