Multiple Choice
The following graph shows U.S.demand for and domestic supply of a good.Suppose the world price of the good is $1.00 per unit and a specific tariff of $0.50 per unit is imposed on each unit of imported good.In such a case,_____.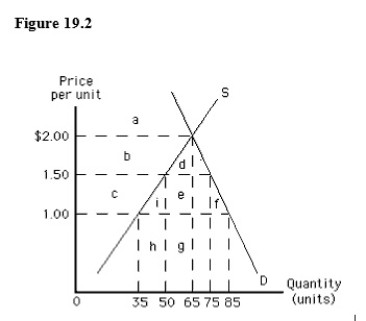
A) 25 units will be exported
B) 25 units will be imported
C) 50 units will be exported
D) 50 units will be imported
E) 10 units will be exported
Correct Answer:

Verified
Correct Answer:
Verified
Q3: The international treaty established to negotiate lower
Q52: Differences in tastes among nations<br>A)make gains from
Q65: Relative to quotas,tariffs lead to a greater
Q66: One of the main motives for the
Q67: Which of the following reasons best explains
Q68: A lump-sum tax per unit on imports
Q71: The source of gains from trade is
Q72: Suppose the government of an importing country
Q73: Suppose one worker in New Ralph Island
Q74: International trade between countries typically produces a