Multiple Choice
The following graph shows U.S.demand for and domestic supply of a good.Suppose the world price of the good is $1.00 per unit and a specific tariff of $0.50 per unit is imposed on each unit of imported good.In such a case,the government revenue from a tariff of $0.50 per unit is represented by the area _____.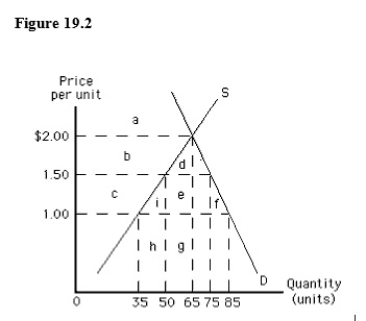
A) c
B) e + g
C) i + e + f
D) d + e
E) e
Correct Answer:

Verified
Correct Answer:
Verified
Q51: Dumping refers to selling a commodity abroad
Q52: The world demand for and the world
Q53: Retaliation of trade restrictions can:<br>A)set off still
Q54: The establishment of GATT resulted in:<br>A)lower tariff
Q56: If quota rights accrue to foreigners,then _.<br>A)the
Q58: Which of the following is a type
Q59: The following graph shows U.S.demand for and
Q60: The following graph shows the demand for
Q61: If production is subject to economies of
Q62: If resources are equally adaptable to the