Multiple Choice
The following graph shows the supply of and demand for baseballs in the United States.If the world price is $3 per baseball and a tariff of $1 per baseball is imposed,then the tariff revenue collected by the United States government is shown by the area _____.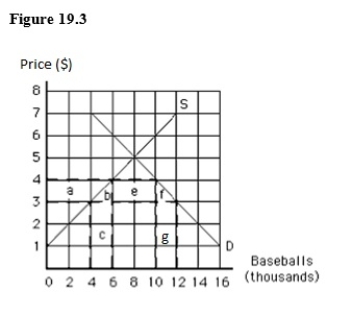
A) a
B) b
C) c
D) f
E) e
Correct Answer:

Verified
Correct Answer:
Verified
Q7: The cost of the resources used by
Q8: The World Trade Organization (WTO):<br>A)members are required
Q9: Which of the following is a difference
Q10: Economies of scale in the production of
Q13: The terms of trade refers to:<br>A)the quantity
Q15: Which of the following is true of
Q16: Which of the following is not correct
Q17: The law of comparative advantage states that:<br>A)each
Q71: The largest regional trading bloc is the<br>A)North
Q102: International trade equalizes the opportunity cost of