Multiple Choice
The following graph shows the demand for and the supply of a good in a country.If the world price of the good is $2.00 per unit,the import quota that would least affect the level of imports in this country is_____.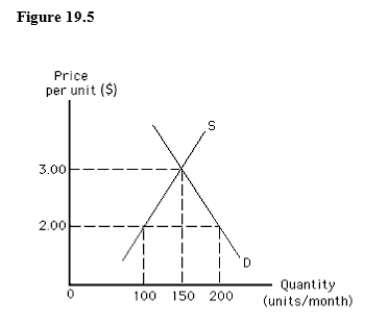
A) $3.00 per unit
B) $2.00 per unit
C) 50 units per month
D) 100 units per month
E) 150 units per month
Correct Answer:

Verified
Correct Answer:
Verified
Q37: If wage rates are lower in Mexico
Q116: A tariff is a tax on either
Q131: Suppose Aharoni and Kalinga are the
Q132: A charge levied on imports in terms
Q133: The consumption possibilities frontier shows:<br>A)a nation's possible
Q134: In the United States,dumping:<br>A)is encouraged because it
Q137: According to some economists,the protection granted to
Q138: Domestic producers of goods who compete with
Q139: Which of the following is not true
Q141: The following image shows the market for