Multiple Choice
The following graph shows the demand for and the supply of a good in a country.If the world price of the good is $2.00 per unit and an import quota of 50 units per month is imposed,then the decrease in consumer surplus can be represented by the area _____.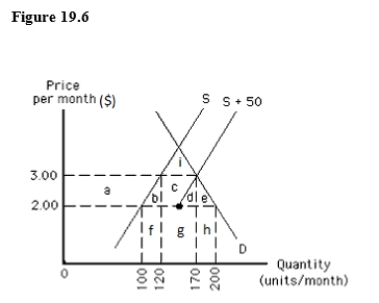
A) f
B) i
C) h
D) f,g,and h
E) a,b,c,d,and e
Correct Answer:

Verified
Correct Answer:
Verified
Q76: Which of the following is true of
Q77: The following table shows per-day production
Q78: The following table shows per-day production
Q79: The temporary sale of products in a
Q82: Suppose there is a policy debate over
Q83: Which of the following is true of
Q85: One reason for international specialization is:<br>A)a high
Q86: Which of the following is not a
Q112: International trade increases world economic efficiency for
Q150: U.S.consumers would be better off if they