Essay
A statistics course at a large university is taught in each semester. A student has noticed that the students in semester 1 and semester 2 are enrolled in different degrees. To investigate, the student takes a random sample of 25 students from semester 1 and 25 students from semester 2 and records their final marks (%) provided in the table below. Excel was used to generate descriptive statistics on each sample.
Assume that student final marks are normally distributed in each semester. 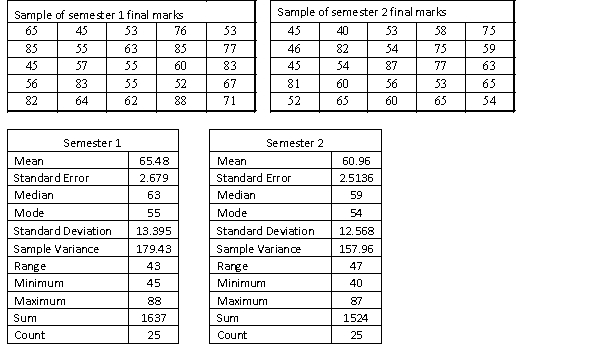 (a) Can we conclude at the 5% level of significance that semester 1 students have a higher proportion of high distinctions than semester 2 students, where a high distinction is a final mark greater than or equal to 85%?
(b) Find the p-value of the test, and explain how to use it to test the hypotheses.
Correct Answer:

Verified
(a) p1 hat = sample proportion of student...View Answer
Unlock this answer now
Get Access to more Verified Answers free of charge
Correct Answer:
Verified
View Answer
Unlock this answer now
Get Access to more Verified Answers free of charge
Q47: The upper limit of the 89.9%
Q48: The lower limit of the 87.4%
Q49: There are different approaches to fitness
Q50: In a hypothesis test for the
Q51: In testing the null hypothesis
Q53: If a null hypothesis about the population
Q54: If a sample has 12 observations and
Q55: The sampling distribution of the random variable
Q56: The sampling distributions we use for nominal
Q57: The sampling distributions we use for numerical