Multiple Choice
Figure 3-2
The production possibilities frontiers below show how much Bob and Betty can each produce in 8 hours of time.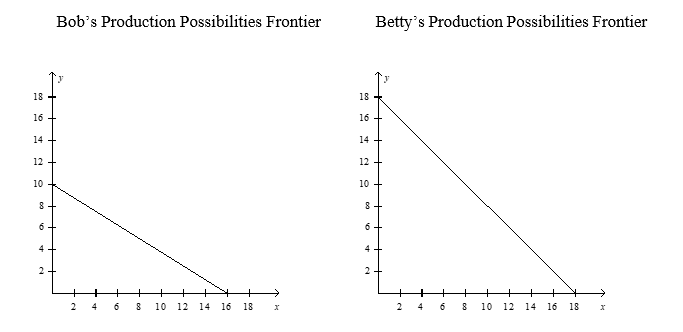
-Refer to figure 3-2.Betty has
A) an absolute and comparative advantage producing good x.
B) an absolute but not a comparative advantage producing good x.
C) a comparative but not an absolute advantage producing good x.
D) neither a comparative nor an absolute advantage producing good x.
Correct Answer:

Verified
Correct Answer:
Verified
Q4: Figure 3-1<br>Panel (a)<br>Panel (b) <img src="https://d2lvgg3v3hfg70.cloudfront.net/TB2297/.jpg" alt="Figure
Q21: Suppose the US and Mexico both produce
Q50: Assume that Greece has a comparative advantage
Q56: Suppose that a worker in Caninia can
Q59: Trade can benefit everyone in society because
Q156: Table 3-7<br>Assume that Japan and Korea can
Q158: Henry can make a bird house in
Q210: Figure 3-6<br> <img src="https://d2lvgg3v3hfg70.cloudfront.net/TB2185/.jpg" alt="Figure 3-6
Q229: Figure 3-5<br> <img src="https://d2lvgg3v3hfg70.cloudfront.net/TB2185/.jpg" alt="Figure 3-5
Q234: Figure 3-3<br> <img src="https://d2lvgg3v3hfg70.cloudfront.net/TB2185/.jpg" alt="Figure 3-3