Multiple Choice
Figure 5-1 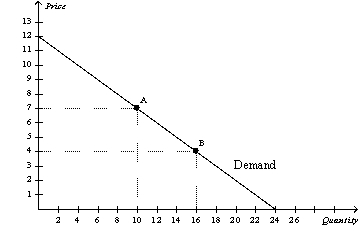
-Refer to Figure 5-1.Between point A and point B,price elasticity of demand using the midpoint method is equal to
A) 0.71.
B) 0.85.
C) 1.18.
D) 1.40.
Correct Answer:

Verified
Correct Answer:
Verified
Q39: Which of the following is likely to
Q73: Figure 5-5<br> <img src="https://d2lvgg3v3hfg70.cloudfront.net/TB2185/.jpg" alt="Figure 5-5
Q104: Moving downward and to the right along
Q113: Fiona's Fish Emporium increased its total monthly
Q132: Table 5-2<br> <img src="https://d2lvgg3v3hfg70.cloudfront.net/TB4799/.jpg" alt="Table 5-2
Q165: The supply of a good will be
Q182: Figure 5-6<br> <img src="https://d2lvgg3v3hfg70.cloudfront.net/TB2185/.jpg" alt="Figure 5-6
Q294: Which of the following could be the
Q435: Figure 5-17<br> <img src="https://d2lvgg3v3hfg70.cloudfront.net/TB2185/.jpg" alt="Figure 5-17
Q457: Figure 5-14<br> <img src="https://d2lvgg3v3hfg70.cloudfront.net/TB2185/.jpg" alt="Figure 5-14