Multiple Choice
Figure 10-1 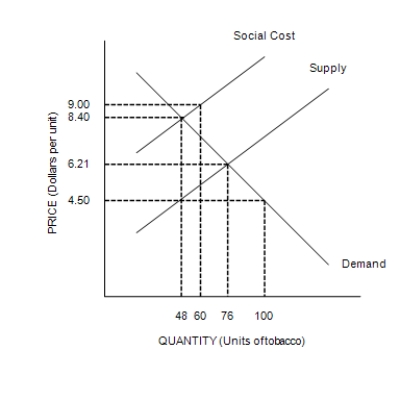
-Refer to Figure 10-1. This graph represents the tobacco industry. The industry creates
A) positive externalities.
B) negative externalities.
C) no externalities.
D) no equilibrium in the market.
Correct Answer:

Verified
Correct Answer:
Verified
Q130: Scenario 10-1<br>The demand curve for gasoline slopes
Q131: According to the Coase Theorem, individuals can
Q132: As a means of dealing with pollution,
Q133: Zaria and Hannah are roommates. Zaria assigns
Q134: Table 10-3<br><br><br> <span class="ql-formula" data-value="\begin{array}
Q136: Figure 10-7 <img src="https://d2lvgg3v3hfg70.cloudfront.net/TB7555/.jpg" alt="Figure 10-7
Q137: Laws that are passed that either require
Q138: The tax on gasoline causes deadweight losses,
Q139: Government intervention is necessary to correct all
Q140: Social welfare can be enhanced by allowing