Multiple Choice
This figure reflects the market for outdoor concerts in a public park surrounded by residential neighborhoods.
Figure 10-3 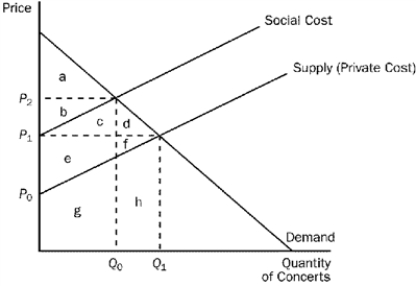
-Refer to Figure 10-3. The difference between the social cost curve and the supply curve reflects the
A) profit margin of each concert.
B) cost of spillover effects from the concert (e.g., noise and traffic) .
C) value of concerts to society as a whole.
D) amount by which the city should subsidize the concert organizers.
Correct Answer:

Verified
Correct Answer:
Verified
Q21: The requirement that a minimum volume of
Q22: According to the Coase theorem, private parties
Q25: Sophia sits behind Gabriel on an airplane.
Q28: When the social cost curve is above
Q31: Which of the following is not a
Q67: Using a supply and demand diagram, demonstrate
Q87: Assume each college degree that is granted
Q115: A technology spillover is a type of
Q119: Patent protection is one way to deal
Q125: Scenario 10-4<br>The demand curve for fire extinguishers