Multiple Choice
Figure 10-9 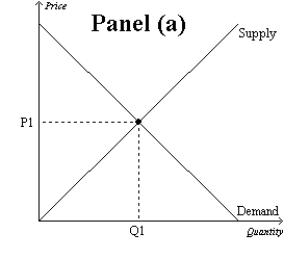
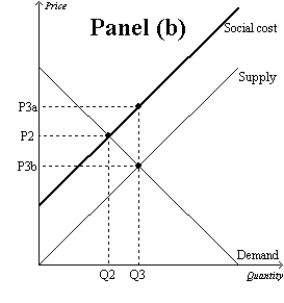
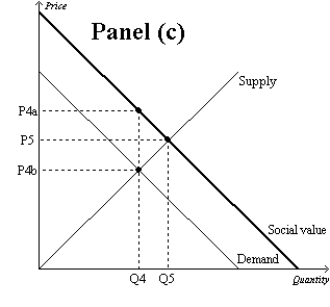
-Refer to Figure 10-9. Which graph represents a market with a negative externality?
A) Panel (a)
B) Panel (b)
C) Panel (c)
D) Both (b) and (c) are correct.
Correct Answer:

Verified
Correct Answer:
Verified
Related Questions
Q6: The majority of economists believe that the
Q439: In terms of their economic effects, which
Q440: Assume that your roommate is very messy.
Q441: Figure 10-8 <img src="https://d2lvgg3v3hfg70.cloudfront.net/TB1273/.jpg" alt="Figure 10-8
Q442: An externality is<br>A)the costs that parties incur
Q443: If gasoline taxes were significantly increased in
Q446: Tradable pollution permits<br>A)have prices that are set
Q447: Which of the following is NOT an
Q448: Which of the following suggests that private
Q449: The difference between social cost and private