Multiple Choice
Figure 10-19 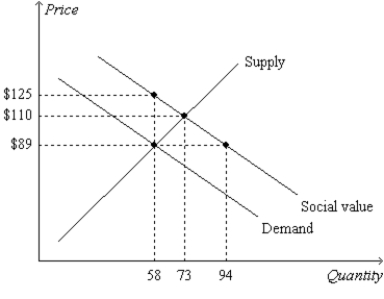
-Refer to Figure 10-19. Note that the lines labeled "Demand" and "Social Value"are parallel. Also, the slopes of the lines on the graph reflect the following facts: (1) Private value and social value decrease by $1.00 with each additional unit of the good that is consumed, and (2) private cost increases by $1.40 with each additional unit of the good that is produced. Thus, when the 74th unit of the good is produced and consumed, social well-being
A) decreases by $2.40.
B) decreases by $1.60.
C) increases by $1.00.
D) increases by $1.40.
Correct Answer:

Verified
Correct Answer:
Verified
Q40: Scenario 10-4<br>The demand curve for fire extinguishers
Q46: Sophia sits behind Gabriel on an airplane.
Q166: Private parties may choose not to solve
Q479: Figure 10-2. The graph depicts the market
Q481: Scenario 10-2<br>The demand curve for restored historic
Q482: In a certain city, the local government
Q486: The Coase theorem states that<br>A)under certain circumstances
Q487: Corrective taxes<br>A)encourage consumers to avoid sales taxes
Q488: The tax on gasoline<br>A)reduces efficiency by causing
Q489: Assuming education results in a positive externality,