Multiple Choice
Figure 13-5 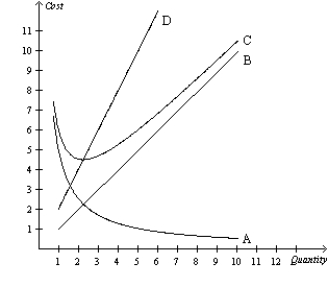
-Refer to Figure 13-5. Which curve is most likely to represent average total cost?
A) A
B) B
C) C
D) D
Correct Answer:

Verified
Correct Answer:
Verified
Related Questions
Q15: The economic field of industrial organization examines
Q43: Marginal cost is equal to average total
Q309: Figure 13-5 <img src="https://d2lvgg3v3hfg70.cloudfront.net/TB1273/.jpg" alt="Figure 13-5
Q310: Table 13-12<br>Eileen's Elegant Earrings produces pairs of
Q311: In the long run a company that
Q312: For a firm, the relationship between the
Q313: Total revenue minus both explicit and implicit
Q316: Table 13-7<br>The Flying Elvis Copter Rides <img
Q317: Patrice owns a travel agency. Her accountant
Q319: Figure 13-5 <img src="https://d2lvgg3v3hfg70.cloudfront.net/TB1273/.jpg" alt="Figure 13-5