Multiple Choice
The following diagram shows two budget lines: A and B. 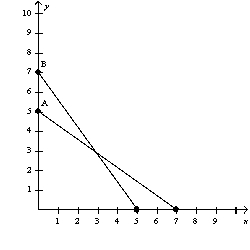 Which of the following could explain the change in the budget line from A to B?
A) a decrease in income and a decrease in the price of X
B) a decrease in income and an increase in the price of X
C) an increase in income and a decrease in the price of X
D) an increase in income and an increase in the price of X
Correct Answer:

Verified
Correct Answer:
Verified
Q18: Which of the following is a property
Q32: Figure 21-1<br> <img src="https://d2lvgg3v3hfg70.cloudfront.net/TB2185/.jpg" alt="Figure 21-1
Q47: A consumer chooses an optimal consumption point
Q49: Figure 21-10 <img src="https://d2lvgg3v3hfg70.cloudfront.net/TB1273/.jpg" alt="Figure 21-10
Q63: Giffen goods are inferior goods for which
Q77: When economists describe preferences, they often use
Q92: Kristi spends all of her income on
Q150: A budget constraint illustrates bundles that a
Q495: Which of the following equations corresponds to
Q568: Giffen goods have positively-sloped demand curves because