Multiple Choice
The following diagram shows one indifference curve representing the preferences for goods X and Y for one consumer. 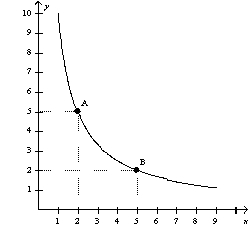 What is the marginal rate of substitution between points A and B?
A) 2/5
B) 1
C) 5/2
D) 3
Correct Answer:

Verified
Correct Answer:
Verified
Q25: Figure 21-1.The figure shows three indifference curves
Q134: The indifference curves for left shoes and
Q251: Figure 21-2 The downward-sloping line on the
Q267: How are the following three questions related:
Q287: When Ryan has an income of $2,000,
Q322: Figure 21-8 <img src="https://d2lvgg3v3hfg70.cloudfront.net/TB1273/.jpg" alt="Figure 21-8
Q336: All Giffen goods are<br>A)inferior goods, and all
Q342: When the price of an inferior good
Q491: The two "goods" used when economists analyze
Q524: Figure 21-10 <img src="https://d2lvgg3v3hfg70.cloudfront.net/TB1273/.jpg" alt="Figure 21-10