Figure 21-19 The Following Graph Illustrates a Representative Consumer's Preferences for Marshmallows
Multiple Choice
Figure 21-19
The following graph illustrates a representative consumer's preferences for marshmallows and chocolate chip cookies:
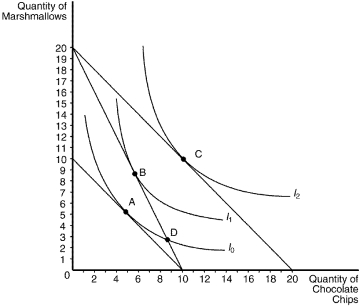
-Refer to Figure 21-19.Assume that the consumer has an income of $40.If the price of chocolate chips is $4 and the price of marshmallows is $4,the optimizing consumer would choose to purchase
A) 9 marshmallows and 6 chocolate chips.
B) 10 marshmallows and 10 chocolate chips.
C) 5 marshmallows and 5 chocolate chips.
D) 3 marshmallows and 9 chocolate chips.
Correct Answer:

Verified
Correct Answer:
Verified
Q11: Consider a consumer who purchases two goods,
Q62: Scenario 21-3<br>Zach knows that he will ultimately
Q64: The following diagram shows a budget constraint
Q66: Figure 21-7 <img src="https://d2lvgg3v3hfg70.cloudfront.net/TB1273/.jpg" alt="Figure 21-7
Q68: Figure 21-26<br>The figure below illustrates the preferences
Q195: A set of indifference curves that are
Q324: Janet prefers cashews to almonds. She prefers
Q368: If the consumer's income and all prices
Q463: Pete consumes two goods, rice and fish.
Q526: Budget constraints exist for consumers because<br>A)their utility