Multiple Choice
Figure 21-22
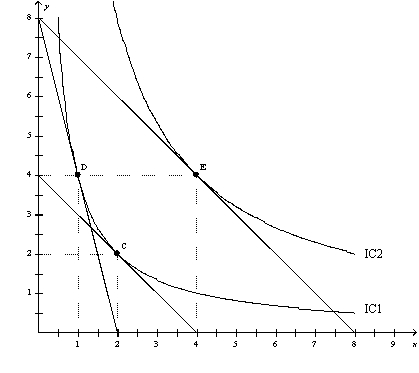
-Refer to Figure 21-22.When the price of X is $80,the price of Y is $20,and the consumer's income is $160,the consumer's optimal choice is D.Then the price of X decreases to $20.The demand curve can be illustrated as the movement from
A) D to E.
B) D to C.
C) C to E.
D) E to D.
Correct Answer:

Verified
Correct Answer:
Verified
Q15: The indifference curves for left gloves and
Q37: A consumer likes two goods: books and
Q39: The theory of consumer choice describes the<br>A)
Q158: The theory of consumer choice is representative
Q165: Suppose the price of good X falls
Q182: Giffen goods have positively-sloped demand curves because
Q202: Figure 21-2<br>The downwardsloping line on the figure
Q243: An inferior good is one in which<br>A)the
Q310: Figure 21-12 <img src="https://d2lvgg3v3hfg70.cloudfront.net/TB1273/.jpg" alt="Figure 21-12
Q376: Which of the following statements is not